The crypto market continues to struggle today, extending yesterday’s losses.
Bitcoin has dropped below $112,000, with the market flashing bearish signals.
Meanwhile, there’s one coin in the top 10 currently defying trends and turning heads: BNB.
The crypto market, including Bitcoin, is today still dealing with the effects of yesterday’s massive liquidation cascade, though the bleeding has slowed.
The total cryptocurrency market capitalization sits at $3.9 trillion, down a slight 0.6% over the past 24 hours, according to CoinGecko. Not bad considering yesterday was the year’s largest liquidation event with over $1.7 billion in leveraged long positions being forcibly closed.
Much like yesterday, though, the tradfi market is faring much better: The S&P 500 is coming off yet another all-time high, showing risk appetite remains alive in equities despite the weakness in crypto markets. Meanwhile, gold reached a new all-time high of $3,790 today as investors hedge against mounting geopolitical tensions in the Middle East.
But some coins are seemingly immune to the crypto market chaos, and that’s apparently the case for BNB, Binance’s native token. BNB is by far the best-performing crypto in the top 10 over the last week, up an impressive 6% in the last seven days—and a whopping 17% over the last 30. All while Bitcoin is struggling. What’s going on? Let’s look at the charts.
Bitcoin (BTC) price: Testing critical support
Bitcoin’s price action today is a continuation of yesterday’s FUD, with the flagship cryptocurrency slipping 0.80% to $111,837.
The daily candle shows an attempted recovery that failed—opening at $112,741, Bitcoin managed to push as high as $113,344 before sellers took control, driving it down to test the $111,571 support level.
If Bitcoin does not find buyers at these prices and bounce, this could lead to more bad news for the bulls out there.
Bitcoin price data. Image: Tradingview
The technical picture shows mounting bearish pressure, though not without hope for bulls.
The Average Directional Index, or ADX, sits at 18 points, which suggests that the bullish trend that took Bitcoin to new heights several weeks ago has weakened.
ADX measures trend strength, regardless of direction, with readings over 25 suggesting established trends in place. When ADX readings stay below 20, it typically means the market is directionless, consolidating before the next major move. For traders, this signals a wait-and-see approach might be prudent, as the market lacks conviction in either direction.
Bitcoin’s Relative Strength Index, or RSI, is at 42, placing BTC in slightly bearish territory without being oversold. RSI measures price momentum on a scale of 0-100, with readings above 70 suggesting overbought conditions and below 30 signaling an oversold market that often precede bounces. At 42, we’re in that uncomfortable middle ground—not low enough to trigger bargain hunting, but high enough for profit-taking.
The Squeeze Momentum Indicator likewise shows that the current price movement seems to place Bitcoin in a bearish impulse phase, which usually points to a more sustained correction before prices climb back up. In other words, not-so-good news for permabulls—at least in the short term.
On Myriad—a prediction market built by Decrypt’s parent company Dastan—traders are nearly split on Bitcoin’s near-term direction. The market “Bitcoin’s next hit: moon to $125K or dip to $105K?” shows the odds of a move to $125K have slipped down to 42%, falling from 69% just five days ago.
On the plus side for bulls, Myriad users remain confident that BTC does not dip below $105K before the end of the month, placing odds at 83% that Bitcoin manages to stay above that mark with seven days to go in the historically bad month for markets.
The coin, formerly known as Binance Coin, is the native token of the BNB blockchain, formerly known as Binance Chain. As you might have guessed, the coin was indeed created and issued by Binance, the world’s largest cryptocurrency exchange by trading volume.
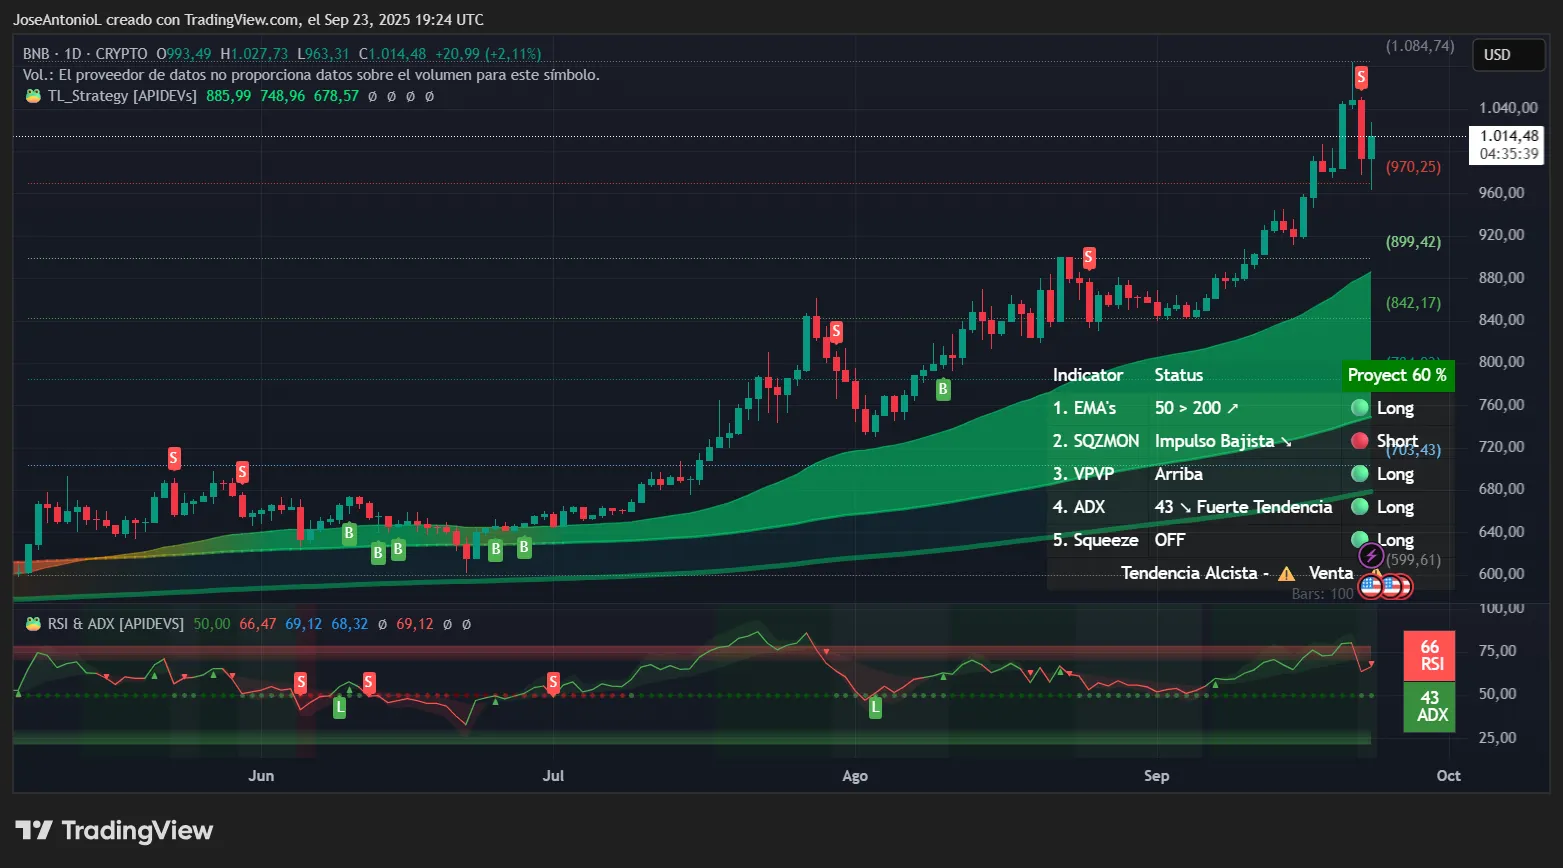
BNB is today the lone coin in the top 10 by market cap in the green, surging 2.6% in the last 24 hours, currently trading for $1,013—just below its all-time high of $1,079. In the last seven days, the coin is up by more than 6% in a display of relative strength that’s catching traders’ attention.
BNB price data. Image: Tradingview
Why is BNB pumping? It likely has a lot to do with the rise of Aster, a decentralized perpetual futures exchange on the BNB blockchain that’s quickly gained enough popularity to challenge what was until very recently the leading DEX for perps, Hyperliquid.
Since BNB is the native gas token on the BNB network, demand for the token typically rises and falls right along with demand for network usage. And right now, there’s nothing hotter in crypto than Aster on BNB. The Aster token itself is up an astronomical 47% today alone, and the DEX it powers recently flipped Hyperliquid in daily revenue generated from trading fees.
All that said, the technical indicators for BNB paint a decisively bullish picture.
The ADX at 43 shows a strong trend in place. The indicator alone suggests BNB’s uptrend has serious legs, and fighting it could be costly for bears. The price of BNB fell today to near its lowest point in a week, then bounced right back up again, displaying just how solid its price trend resistance is at the moment.
The RSI at 66 sits in the sweet spot for continued gains. While approaching overbought territory (above 70), there’s still room to run before automatic profit-taking from traders generally kicks in. Experienced traders know that, in strong trends, coins like BNB could push higher before needing a breather.
Traders also rely on exponential moving averages, or EMAs, to give them a sense of where price supports and resistances are for a given asset over the short, medium, and long term. And, in this case, the EMAs for BNB tell a compelling story.
At the moment, the 50-day EMA (short term) is well above the 200-day EMA (the long term). What this means for traders is that BNB is in a setup where short-term momentum overwhelms long-term resistance. What’s more, the current price of BNB is well above both averages, showing that the bullish move has strong momentum.
And all of that is happening against the background of a crypto market seemingly on the ropes and in need of a serious breather. The fact that BNB is rising despite negative market momentum strengthens the bullish case—it’s swimming against the current successfully.








Be the first to comment